A footnote is a good location to note what filters have been applied to a dashboard. A user may sometimes forget which filter values s/he selected, so the footnote summarizes this information in a central location, usually at the bottom of a dashboard.
- To create a footnote, you first need to create a new blank worksheet.
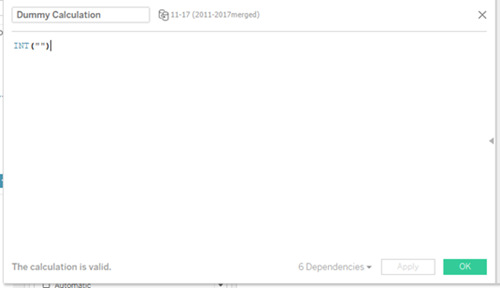
- Then create a dummy calculation.
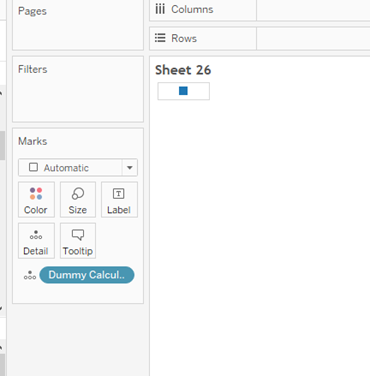
- Place the dummy calculation onto the Detail pane.
- Right click on the square in the view and select Format.

- Remove the row and column dividers.

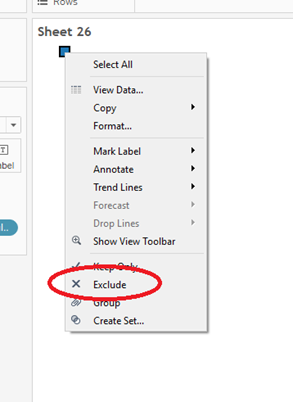
- Right click on the square again and select Exclude.
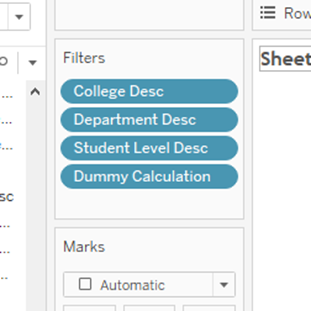
- Place the dimensions you are using as filters in your dashboard onto the Filters
- Right click on the worksheet title and click Edit Title.
- Click on the Insert drop-down list and the dimensions you just added to your Filters pane should display at the bottom.
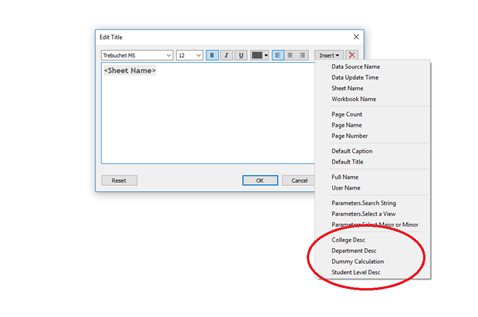
- Select each dimension to add them to the title.
- Make sure to properly label each dimension and add a title as explanation (i.e. Filters Applied).
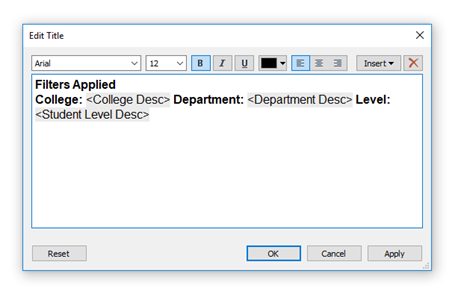
- Click OK.
- The values selected in your main worksheet should display in the title.
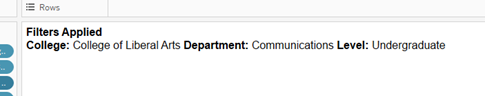
- Save the worksheet.
- Navigate to your dashboard and locate the new footnote worksheet in your Sheets
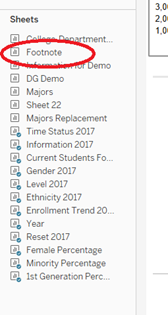
- Drag and drop the footnotes onto your dashboard and position it at the bottom.
- Test the filters to make sure they are applied in the footnotes. If not, you may need reapply your filters.
- Click on the filter that isn’t working and click on the More Options Then hover over Apply to Worksheets and click Selected Worksheets.
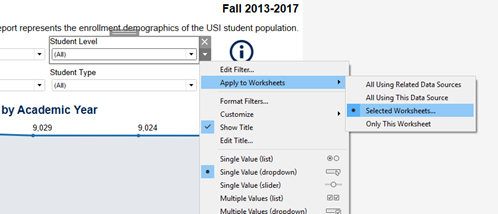
- Locate the footnote worksheet in the list, check it and click OK.
- The filter should then work properly.
Download Dashboard Footnote PDF